Multiplexed 3D atlas of state transitions and immune interactions in colorectal cancer
Lin JR, Wang S, Coy S, Tyler M, Yapp C, Chen YA, Heiser CN, Lau KS, Santagata S, Sorger PK
Cell, 186, 1-19, DOI: 10.1016/j.cell.2022.12.028
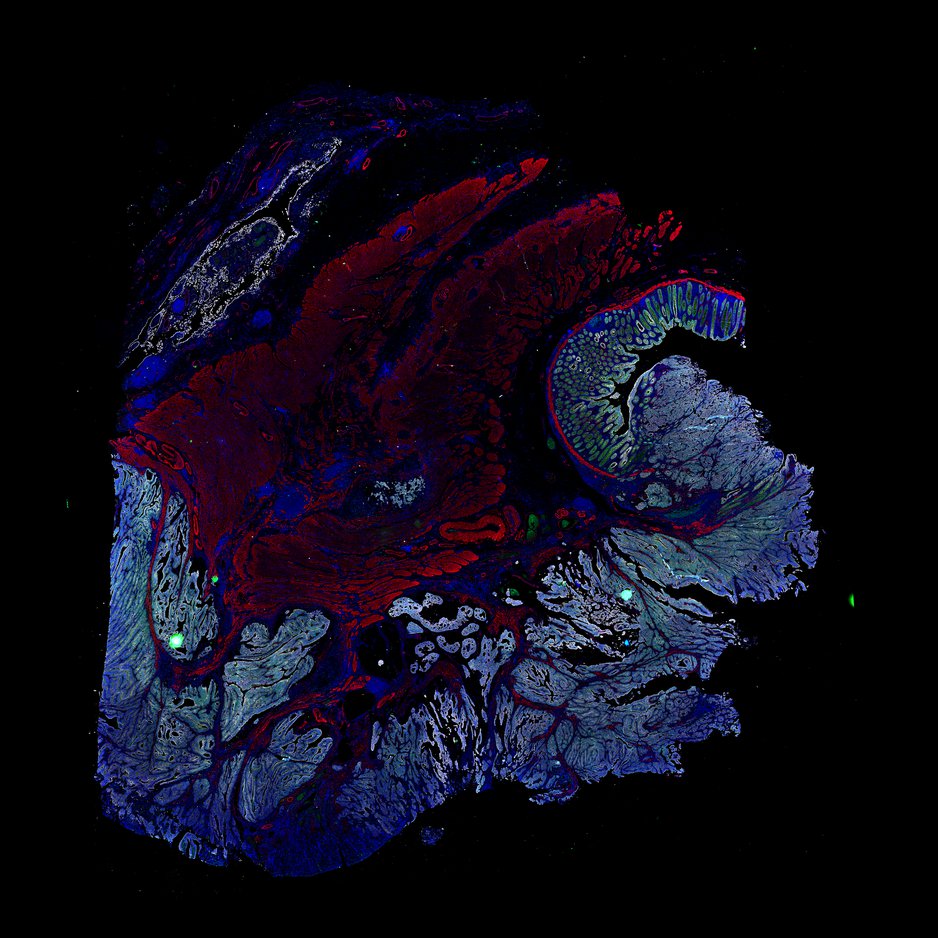
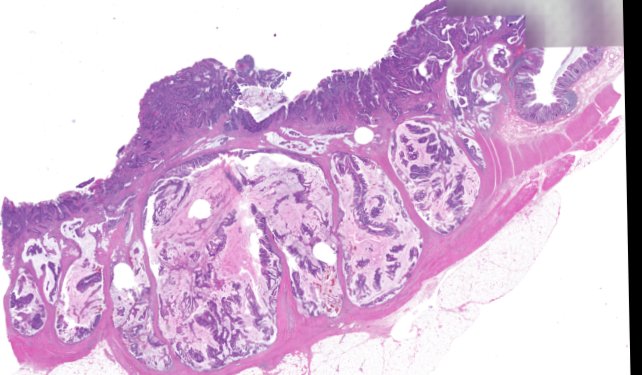
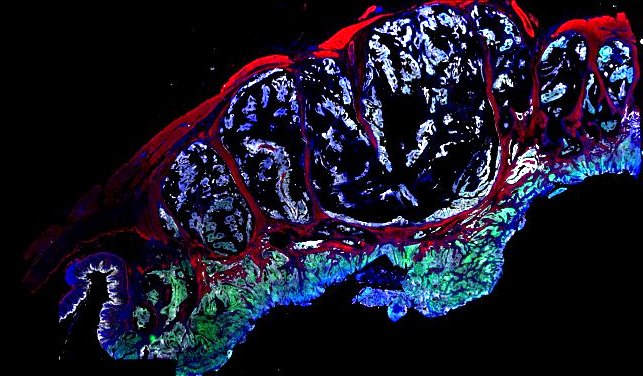
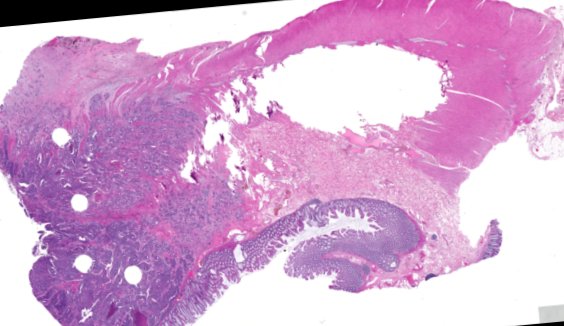
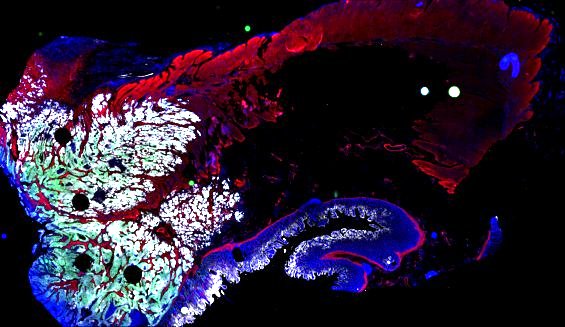
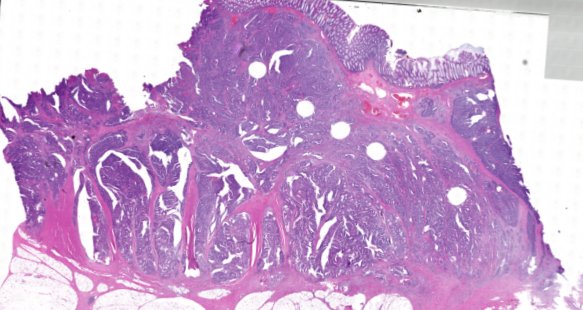
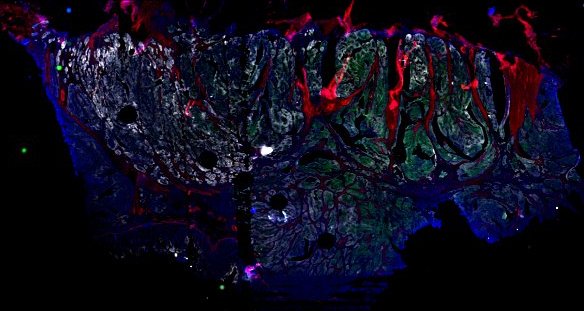
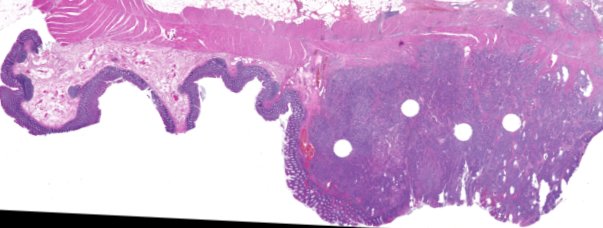
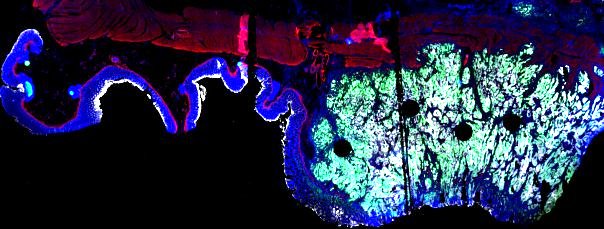
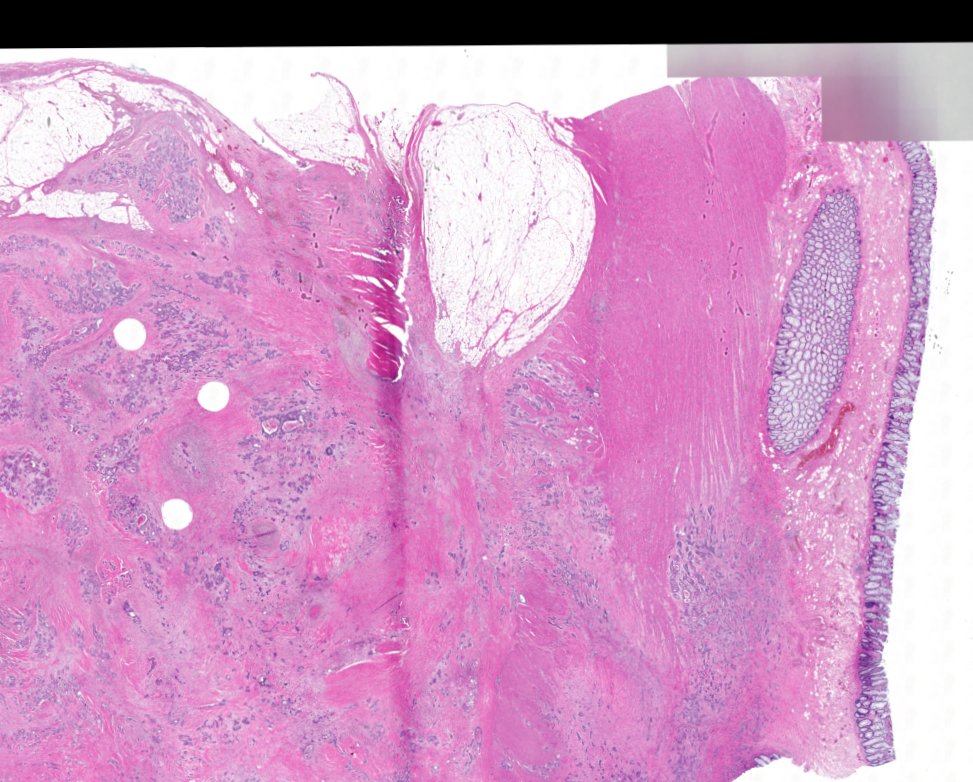
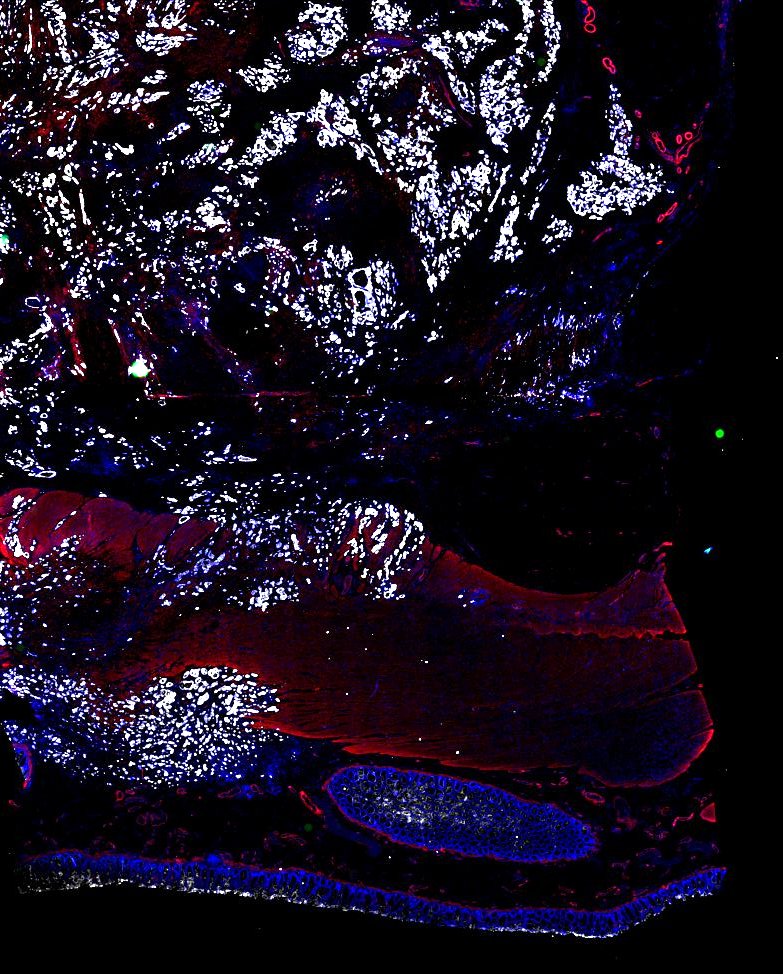
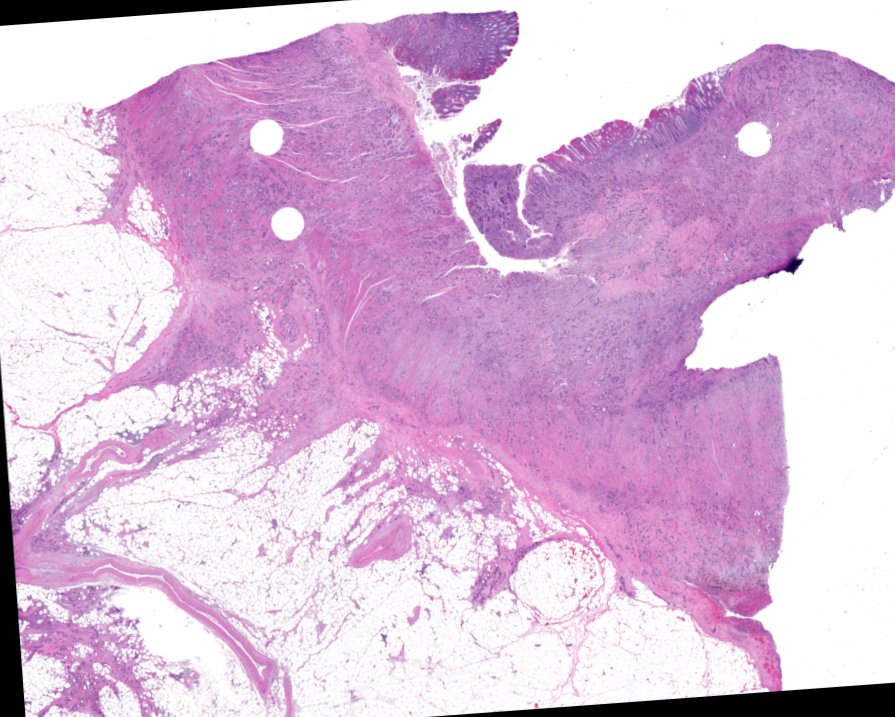
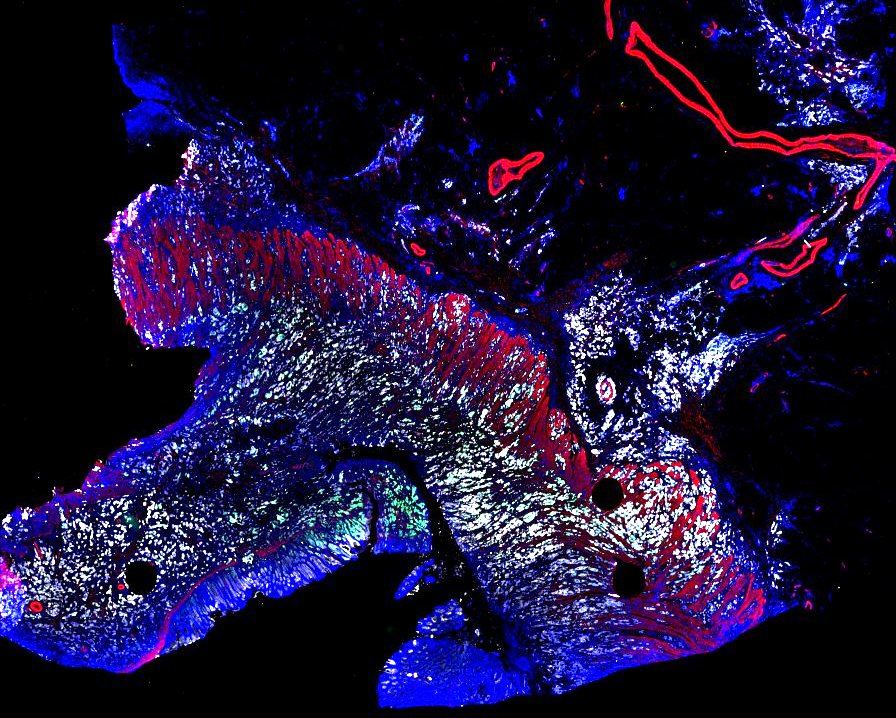
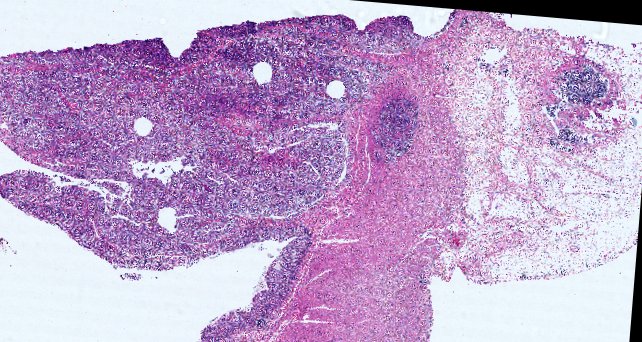
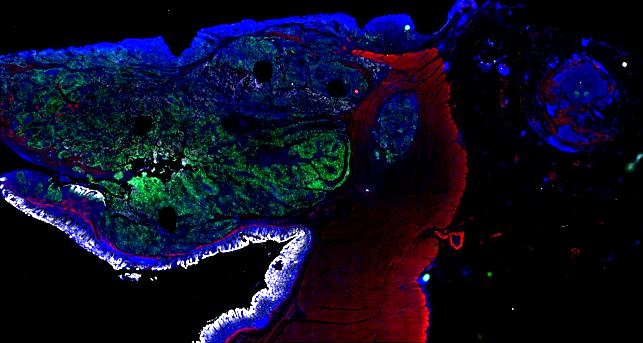
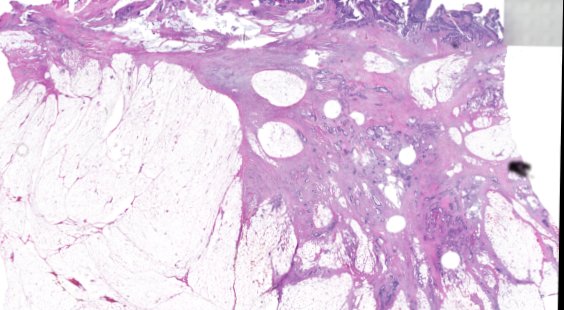
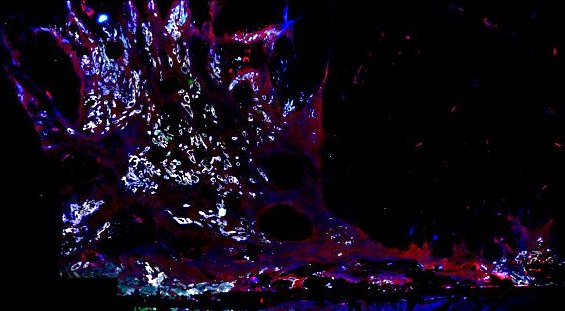
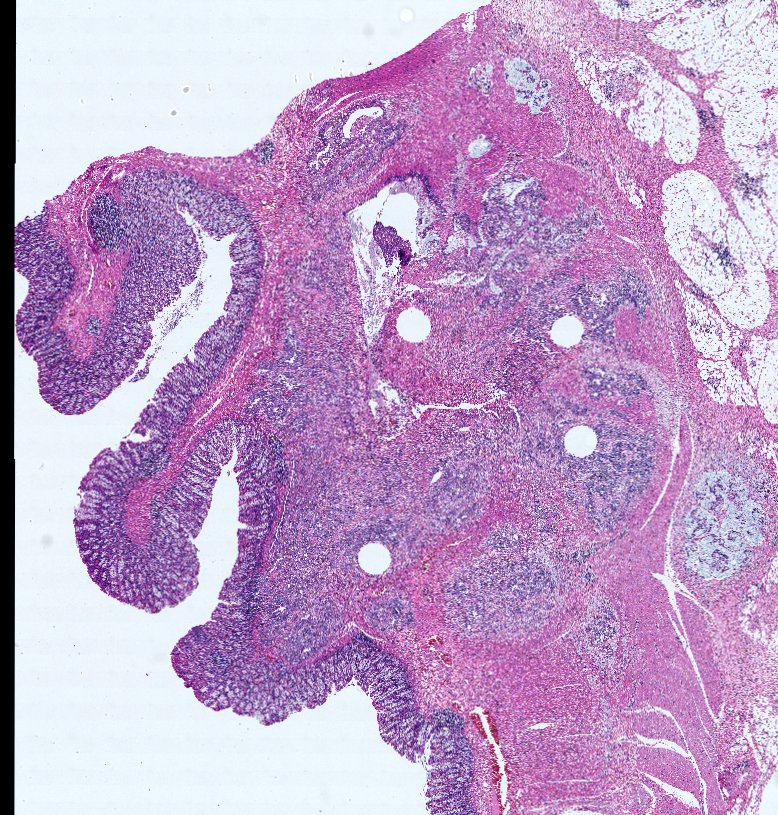
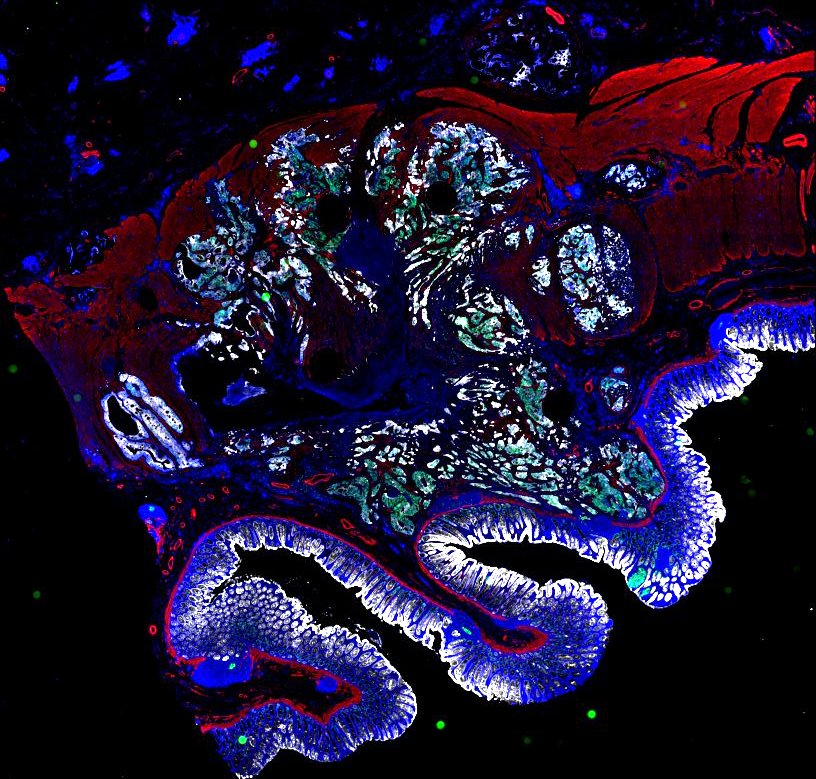
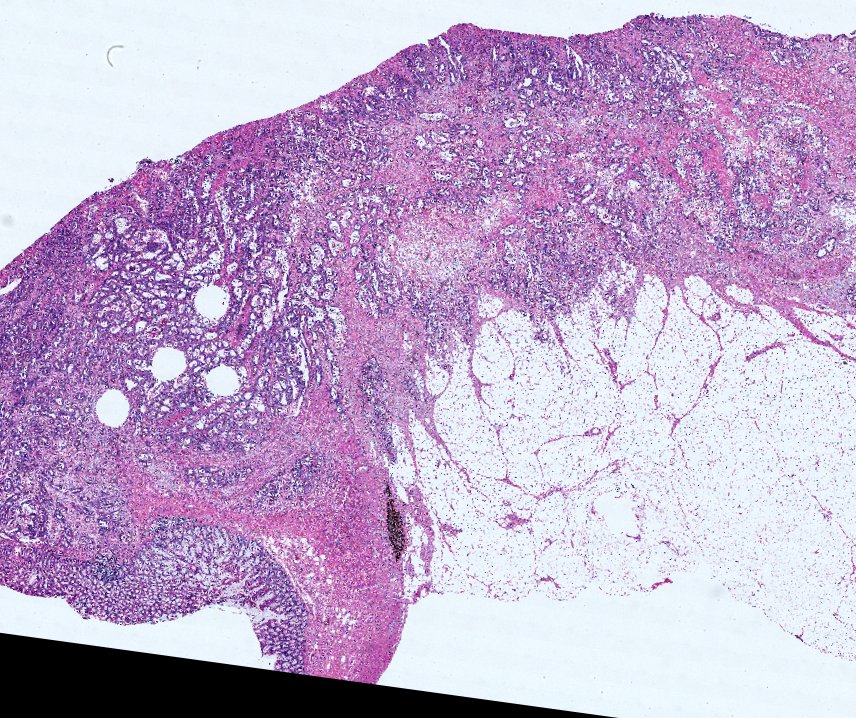
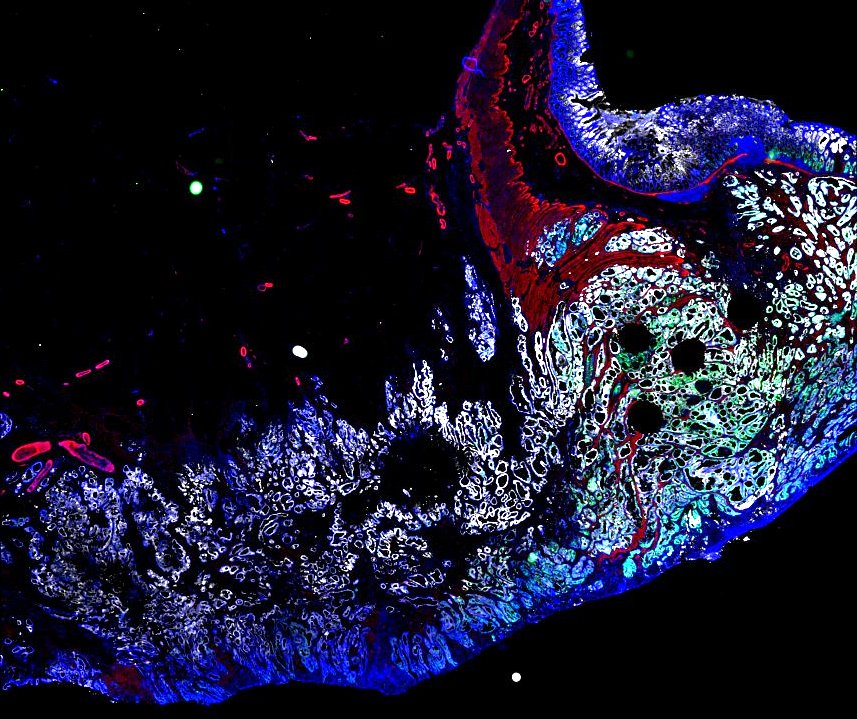
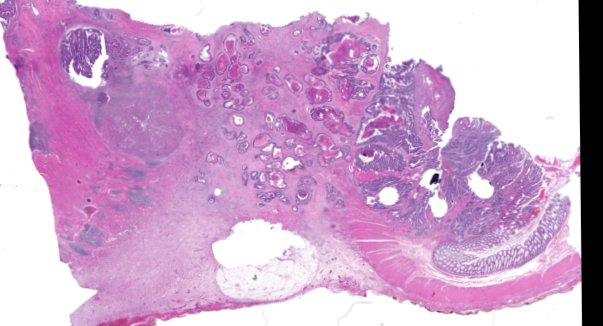
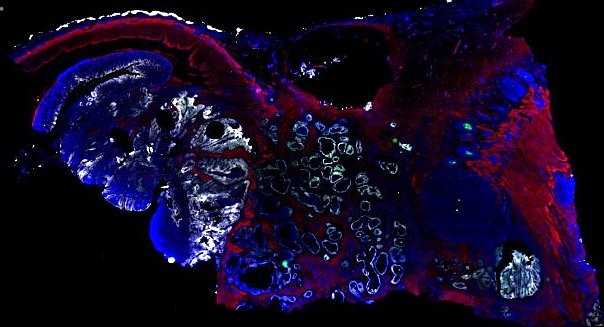
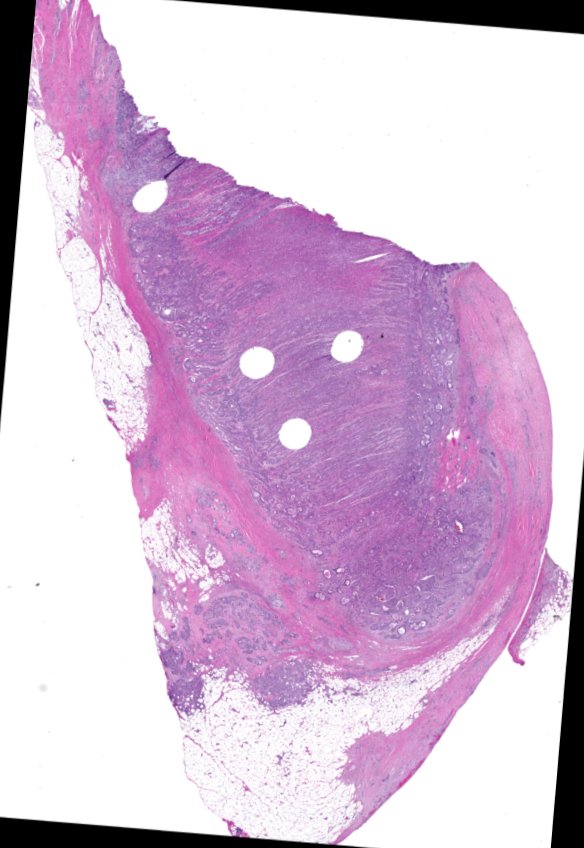
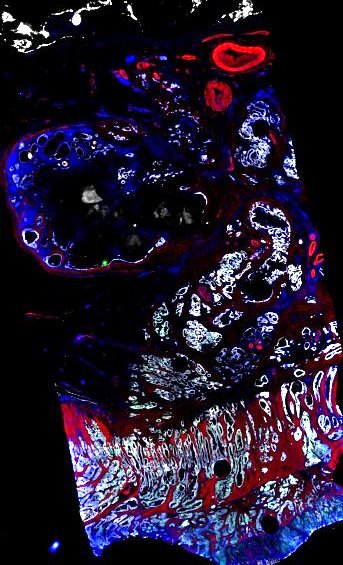
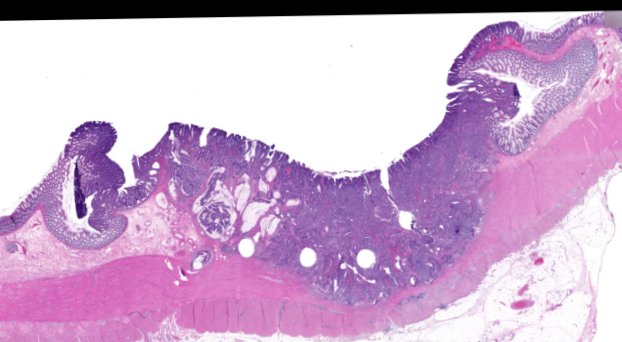
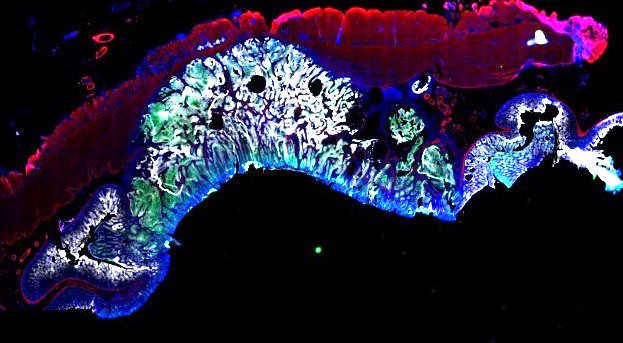
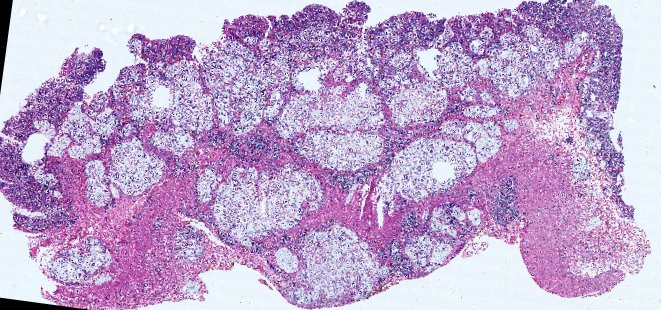
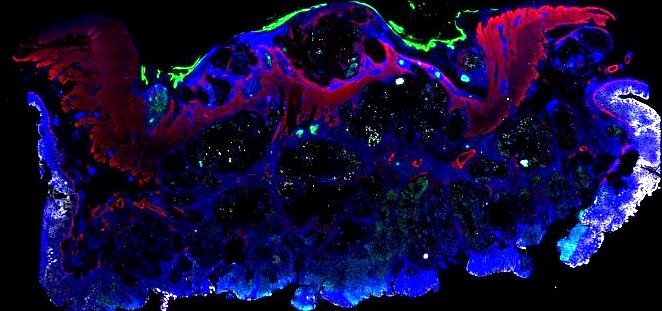
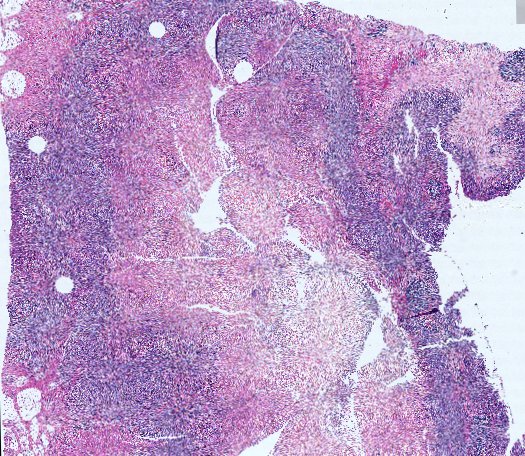
Advanced solid cancers are complex assemblies of tumor, immune, and stromal cells that invade adjacent tissue and spread to distant sites. Here we use highly multiplexed tissue imaging, spatial statistics, and machine learning to identify cell types and states underlying morphological features of known diagnostic and prognostic significance in colorectal cancer. We find that a thorough spatial analysis requires imaging the entire tumor region, not small fields of view (e.g. those found in tissue microarrays). When this condition is met, the data reveal frequent transitions between histological archetypes (tumor grades and morphologies) correlated with molecular gradients. At the tumor invasive margin, where tumor, normal, and immune cells compete, localized features in 2D such as tumor buds and mucin pools are seen in 3D to be large connected structures having continuously varying molecular properties. Immunosuppressive cell-cell interactions also exhibit graded variation in type and frequency. Thus, whereas scRNA-Seq emphasizes discrete changes in tumor state, whole-specimen imaging reveals the presence of large- and small-scale spatial gradients analogous to those in developing tissues.
Publication Preprint Colorectal Cancer Atlas Access Primary DataKey Findings:
-
Multiplexed analysis shows intermixed tumor morphologies and molecular gradients
-
Various cancer characteristic cellular features are large, interconnected structures
-
3D tertiary lymphoid structure (TLS) networks show intra-TLS patterning variation
-
PD1-PDL1 interactions are primarily between T and myeloid cells in this CRC cohort
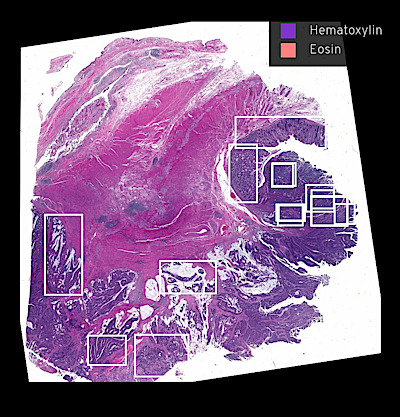
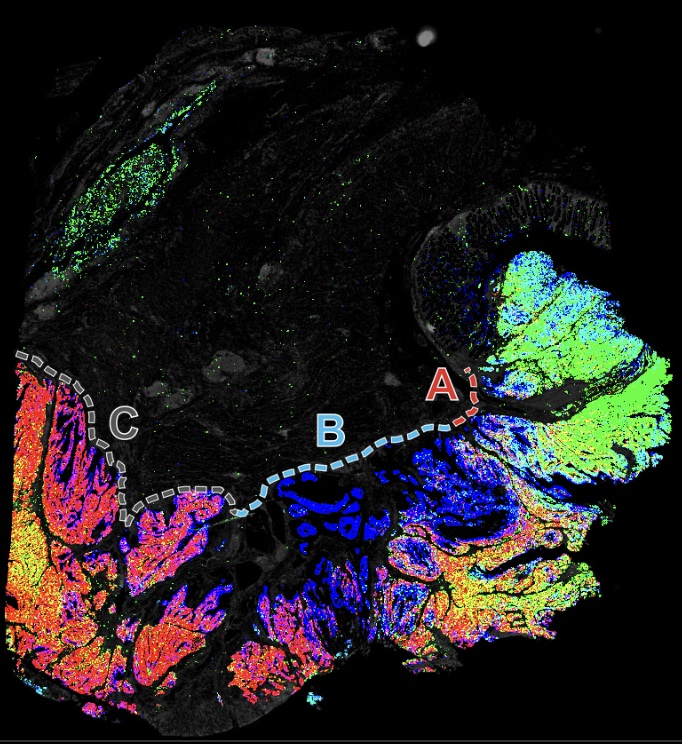
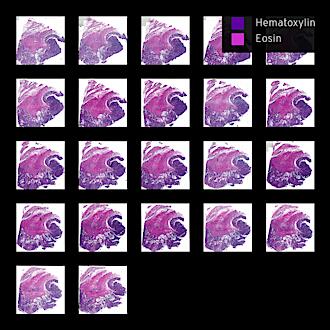
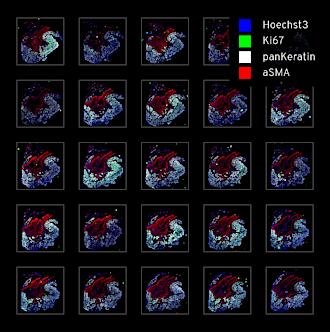
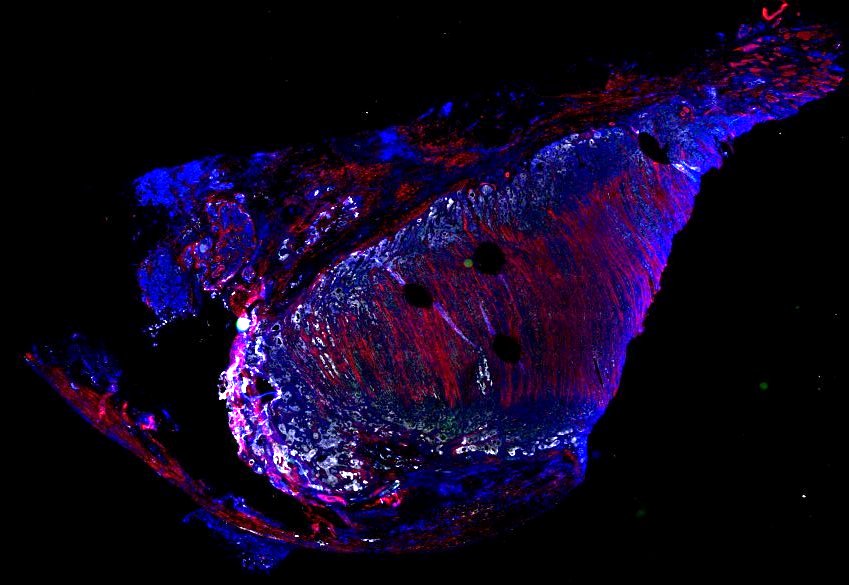
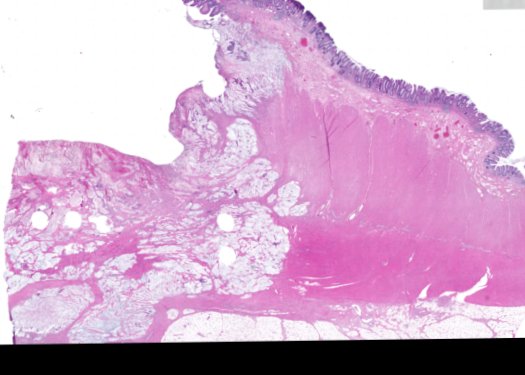
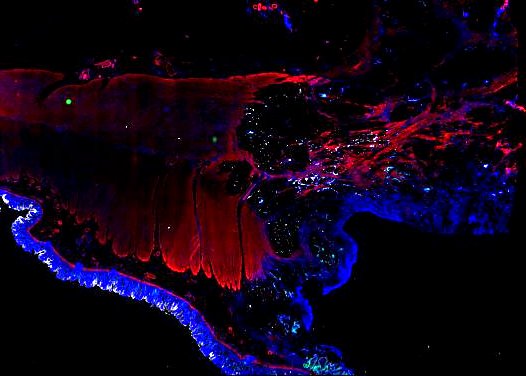
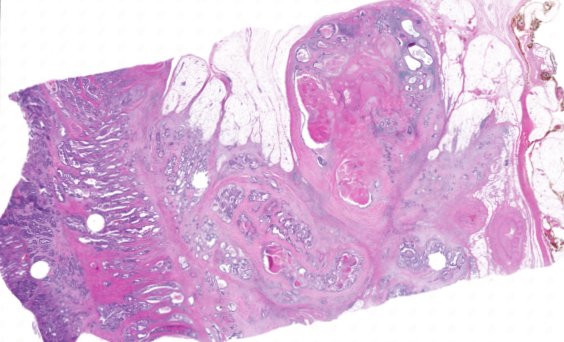
Figure overview of the Colorectal Cancer Atlas dataset: The colorectal cancer atlas contains detailed 3D analysis of one CRC tissue specimen with CyCIF, H&E, and spatial transcriptomics, whole slide imaging of 16 additional tumor samples, and tissue microarray analysis of 92 tumors.
Narrated Minerva Stories
Narrated stories use multi-step narrations and annotations to walk a viewer through key features of the data. Narrated stories distill the multidisciplinary knowledge encompassed by each dataset into a single product that grounds the scientific analyses in the underlying data and metadata. Click the Minerva story icon for an interactive view of the full-resolution images.
Curated Minerva Stories
Curated stories provide access to images that have undergone a quality control step to remove failed markers, ensure appropriate channel intensity settings, and provide metadata about the underlying sample and image. Click the Minerva story icon for an interactive view of the full-resolution images.
Automated Minerva Stories
Automated stories provide basic image viewing with automatic rendering settings, enabling rapid, lightweight sharing of highly multiplexed images, without download. Click the Minerva story icon for an interactive view of the full-resolution images.
Data access
The images in Lin et al. (2023) comprise a ~4.5 TB dataset. All full resolution images, derived image data (e.g., segmentation masks) and all cell count tables are available at DOI: 10.5281/zenodo.7506942. This data will eventually also be available via the NCI-sponsored repository for Human Tumor Atlas Network (HTAN; https://humantumoratlas.org).