Temporal and spatial topography of cell proliferation in cancer
Giorgio Gaglia, Sheheryar Kabraji, Danae Rammos, Yang Dai, Ana Verma, Shu Wang, Caitlin E. Mills, Mirra Chung, Johann S. Bergholz, Shannon Coy, Jia-Ren Lin, Rinath Jeselsohn, Otto Metzger, Eric P. Winer, Deborah A. Dillon, Jean J. Zhao, Peter K. Sorger & Sandro Santagata
Nature Cell Biology. 2022 Mar; 24(3): 316-326. PMID: 35292783. PMCID: PMC8959396.
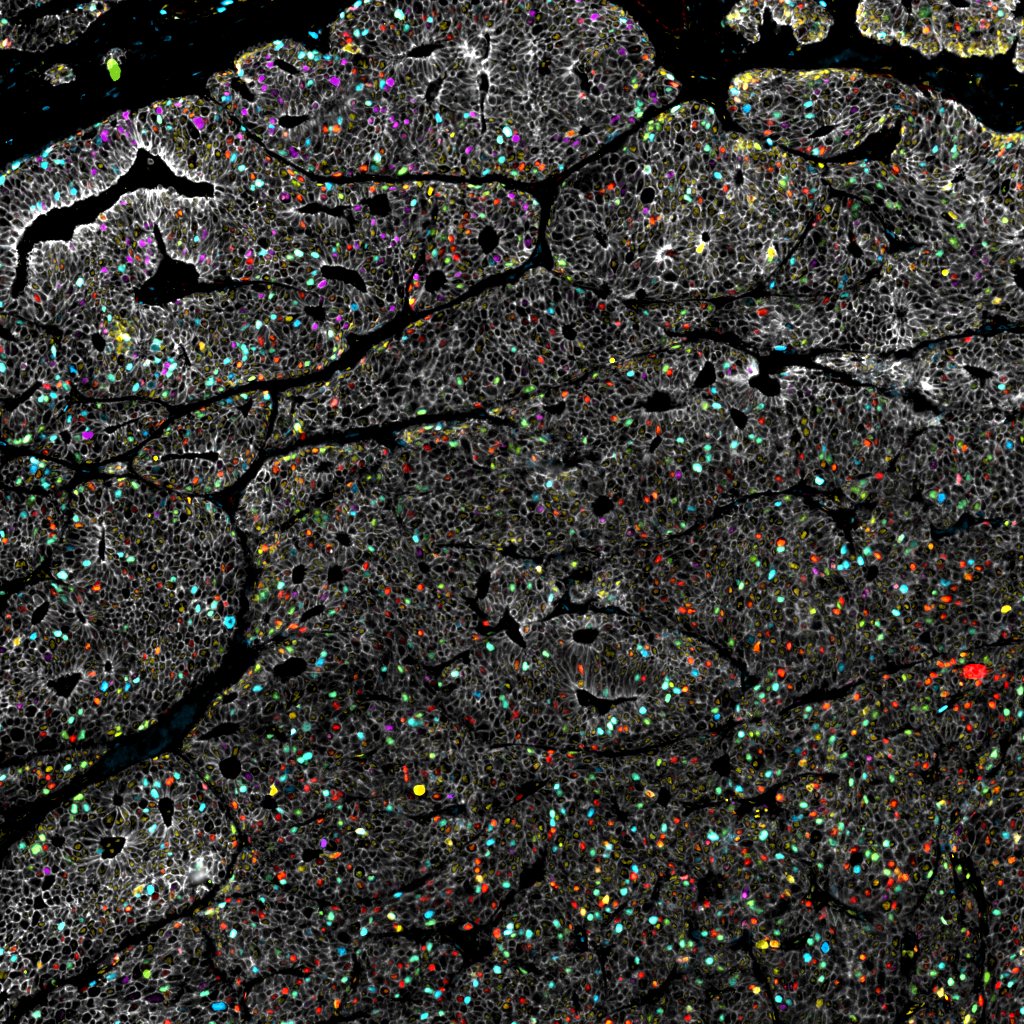
Proliferation is a fundamental trait of cancer cells but its properties and spatial organization in tumors are poorly characterized. Here we use highly multiplexed tissue imaging to perform single-cell quantification of cell cycle regulators and develop robust, multivariate, proliferation metrics. Across diverse cancers, the proliferative architecture is organized at two spatial scales: large domains, and local niches enriched for specific immune lineages. Some tumor cells express cell cycle regulators in the (canonical) patterns expected of freely growing cells, a phenomenon we refer to as “cell cycle coherence”. By contrast, the cell cycles of other tumor cell populations are skewed toward specific phases or exhibit non-canonical (incoherent) marker combinations. Coherence varies across space, with changes in oncogene activity and therapeutic intervention, and is associated with aggressive behavior. Thus, multivariate measures from high-plex tissue images capture clinically significant features of cancer proliferation, a fundamental step in enabling more precise use of anti-cancer therapies.
Publication PubMed Access Primary DataNarrated Minerva Stories
Narrated stories use multi-step narrations and annotations to walk a viewer through key features of the data. Narrated stories distill the multidisciplinary knowledge encompassed by each dataset into a single product that grounds the scientific analyses in the underlying data and metadata. Click the Minerva story icon for an interactive view of the full-resolution images.
Analysis
Image analysis matlab codes can be found at www.github.com/santagatalab/manuscripts-codes-gaglia-kabraji-2021
Primary Data Access
You can vew the multiplexed t-CyCIF images on Omero.
Download the primary data
Download the primary data
The multiplexed single-cell spatially resolved data are shared in folders within the “files” section on Synapse (Synapse ID: syn22300771. Numerical data, contains the outputs of the image analysis pipeline and the matlab codes used to plot the figures in the paper. Please refer to the readme.txt file for description of the data.
| Dataset/Folder Name | Description |
|---|---|
| DATASET01_HER2_3x | Figures: 1 (A-C,E), 2(A), 3(A-F), 4(B-G), ED*1 (B,D,G), ED2(C), ED3(A-D), ED5(F,I,K,L), ED7(A-F) |
| DATASET02_LungSCC | Figures: 1(E), 2(D), ED1(A,B), ED2(A) |
| DATASET02_Ovarian | Figures: 1(E), 2(D,H,I), ED1(A,B), ED2(B) |
| DATASET03_MCF10a | Figures: 3(G-J), ED5(A,B,G,J) |
| DATASET04_GEMM_HER2dox | Figures: 5(E-I), ED8(B,C) |
| DATASET05_TNBC_PreOnPost | Figures: 2(E ), 6(B-G) |
| DATASET06_PantomicsTMA | Figures; 1(F,G), 2(F,G), ED1(K) |
| DATASET07_HER2_ClinicalTrial | Figures: 5(B,C) |
| DATASET08_ER_ClinicalTrial | Figures: 2(E ), 6(H,I) |
| DATASET09_MultibreastTMA | Figures; 2(B,D), 5(A), ED2(D-F), ED7(A) |
| DATASET10_ColonTMA | Figures: 2(B,D), ED1(A,C), ED2(D-F) |
| DATASET11_GliomaTMA | Figures: 2(B,D), 7(A-B), ED1(A,C), ED2(D-F), ED9(A-C) |
| DATASET12_MesotheliomaTMA | Figures: 1(C), 2(B,D), 7(A-B), ED1(A,C, D, G), ED2(D-H), ED9(A-C) |
| DATASET13_CHTNTMA | Figures: ED1(E,H-J) |
| DATASET14_PantomicsTMA_SerialSections | Figures: 1(D), ED1(F) |
| DATASET15_MulticellLine_pCyCIF | Figures: 3(K, L), ED6(B,D) |
| DATASET16_MCF7_Xenograft_TMA | Figures: 3(M), ED6(E-G) |
| MultiLine GR metrics | GR Metrics for the Multicell Line pCyCIF dataset |
| Spatial Correlation Whole Tissue Analysis | Figures: 2(D) |
| Time Inference Comparison | |
| Functions | Codes used for the ccD-CMD analysis, plus other helper functions |
| README | Data file descriptions and usage notes |